What is User Retention?
User Retention is a metric that helps you understand how well your SaaS is doing. It provides visibility of how long users stick around your solution, be it a product, a platform or a service. You want to understand how frequently and for how long your users are engaging with what you provide. Client retention is, in its simplest definition, a number that represents for how long users are “retained” by your product.
How is User Retention calculated
User Retention can have different meanings, depending on how you define or calculate it. The most common calculation is defined by aggregating the time between the user's first visit until they disengage. It can also be measured from the first time they convert and become (paid) users, or simply from the registration moment until the cancellation of the user account.
Doing User Retention analysis
Most analytics tools offer some form or another of retention reports. All those will include a version of the User Retention metric. The Tenstars dashbard provides a chart with a visualisation that connects the number of retained accounts, the number of recovered accounts and the extra revenue they represent.
Note: Retained accounts are intercepted and saved uppon a cancellation requested while recovered accounts are engaged after cancellation by following up.
One of the most usual analytics tools out there, Google Analytics identifies a new user as anyone who doesn't have both a Google Analytics cookie and Client ID from your site or Instance id from your app. Users whom already have these are considered returning users. Thanks to those two values, GA's retention reports display different cohorts, as well as measurements of the revenue they are bringing to the site (if we choose to track transactions with the tool).
User retention cohorts
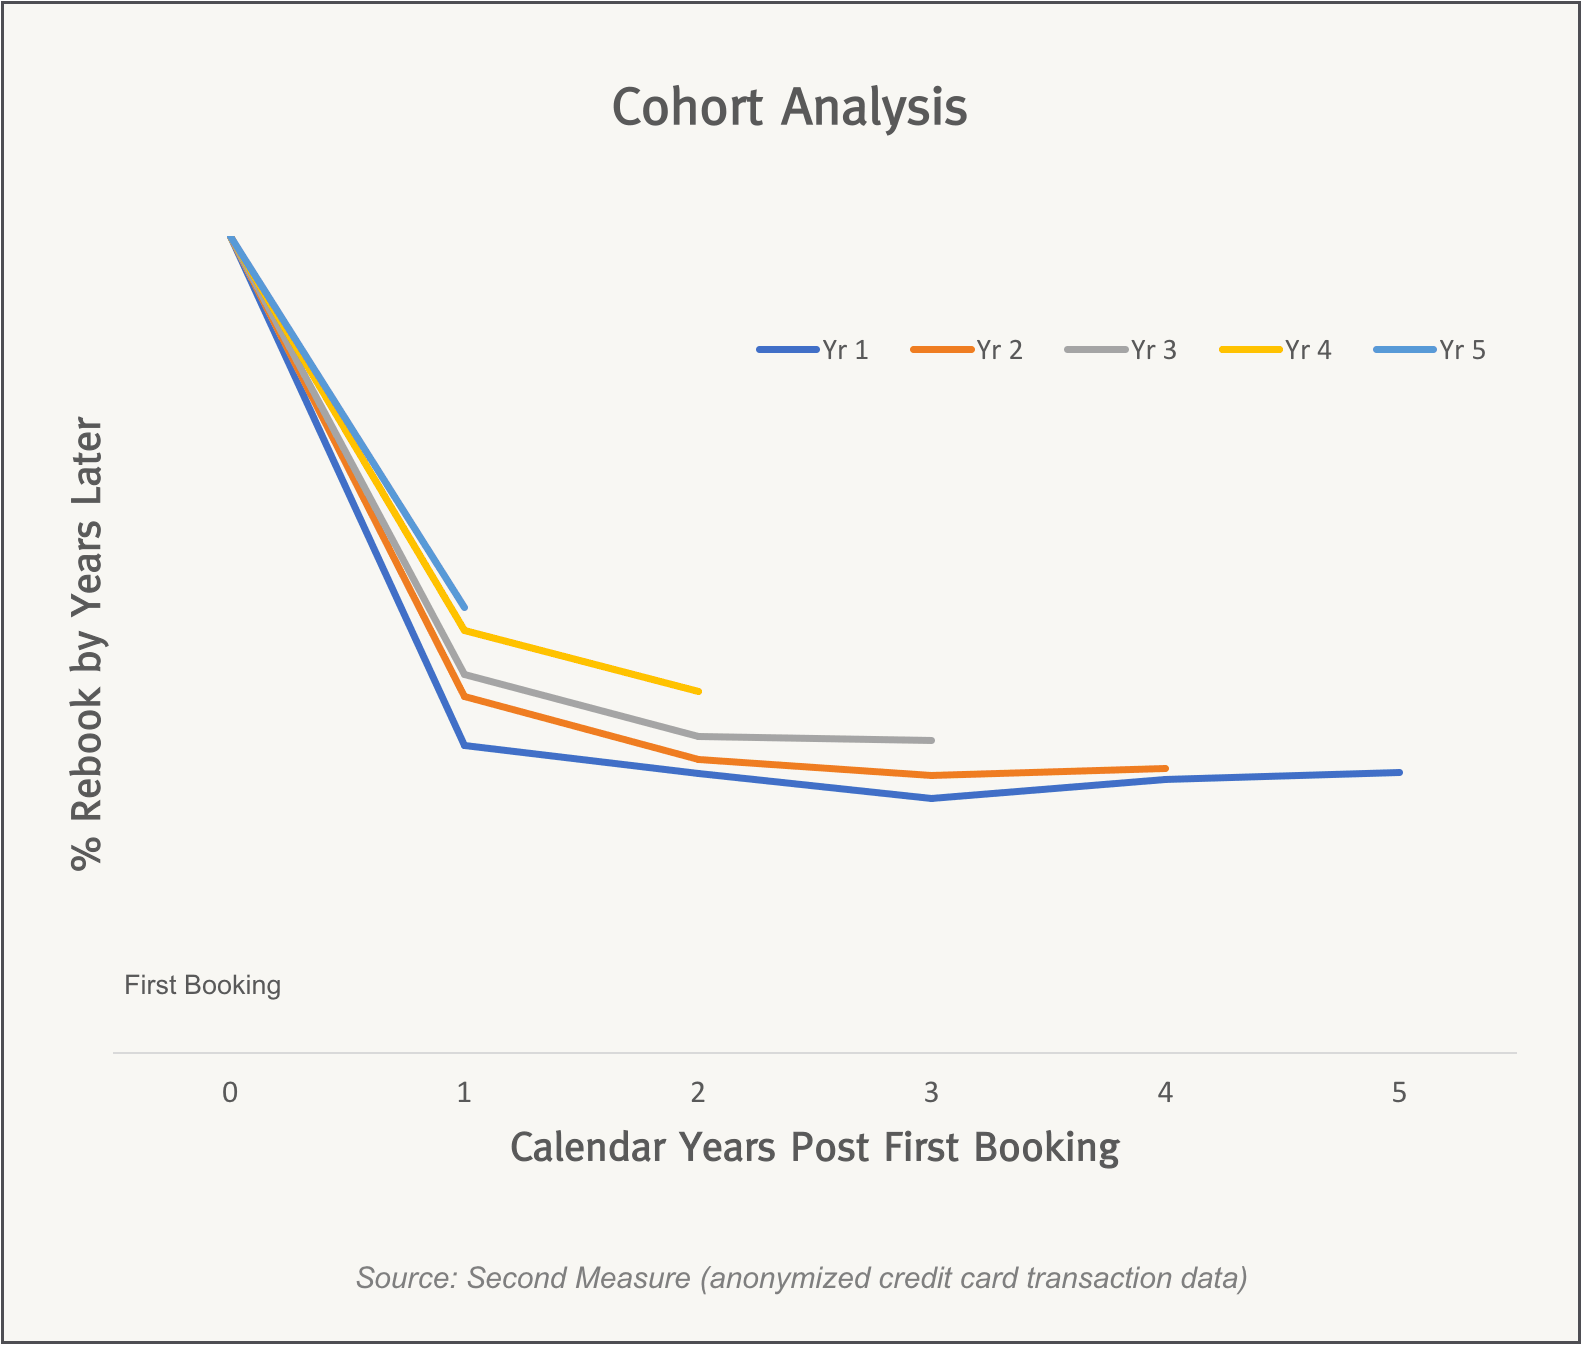
User retention cohorts are the most common way to visualise retention. This type of chart shows the percentage of new users remaining over time since the reference core event. For GA, this is the moment they hit the site for the first time and return on their second and following days.
Ex. Cohort analysis, by User Retention:
We use retention cohorts to take the pulse of our SaaS. We compare cohorts of different weeks or months, and how they evolve. Decoupling in different groups allows to visualize data more clearly. Otherwise, the different accelerations on user acquisition might obscure the analysis. By linking the different groups with a timeline of actions and initiatives, you can discover how efficiently you are leveraging your resources; and how much impact your actions are having on the amount of wealth captured by your business.
Linking groups is important because it enables you to see how trying different actions, isolating variables etc. can improve results.
Ex. “In June we added feature X to our product. Since then, all cohorts are capturing 10% more of value on average”.
Net Revenue Retention (NRR)
Calculating Net Revenue Retention (NRR) using retention cohorts is an effective way of charting how much revenue you are able to retain each month from each group. It is key and probably the preferred way for analysts to partially measure the health of a business.
Logo Retention
Logo Retention, on the other hand, helps us visualise the number of active users that remain on our platform. Depending on the kind of business, industry and size, the benchmark for this metric can be something different. The more difficult the onboarding process in terms of friction (POs, account managers, cross dept. authorisations,…), the more you should worry about having a lower retention. For smaller SaaS, something around 80% logo retention should be borderline okay.
How do I use the User Retention metric in my SaaS today?
User retention is a different way to look at your subscription churn rate. It is directly connected to churned revenue and the growth of your SaaS. One of the best practices during a performance analysis is to understand the focus of the analysis as part of a whole.
User Retention Benchmark
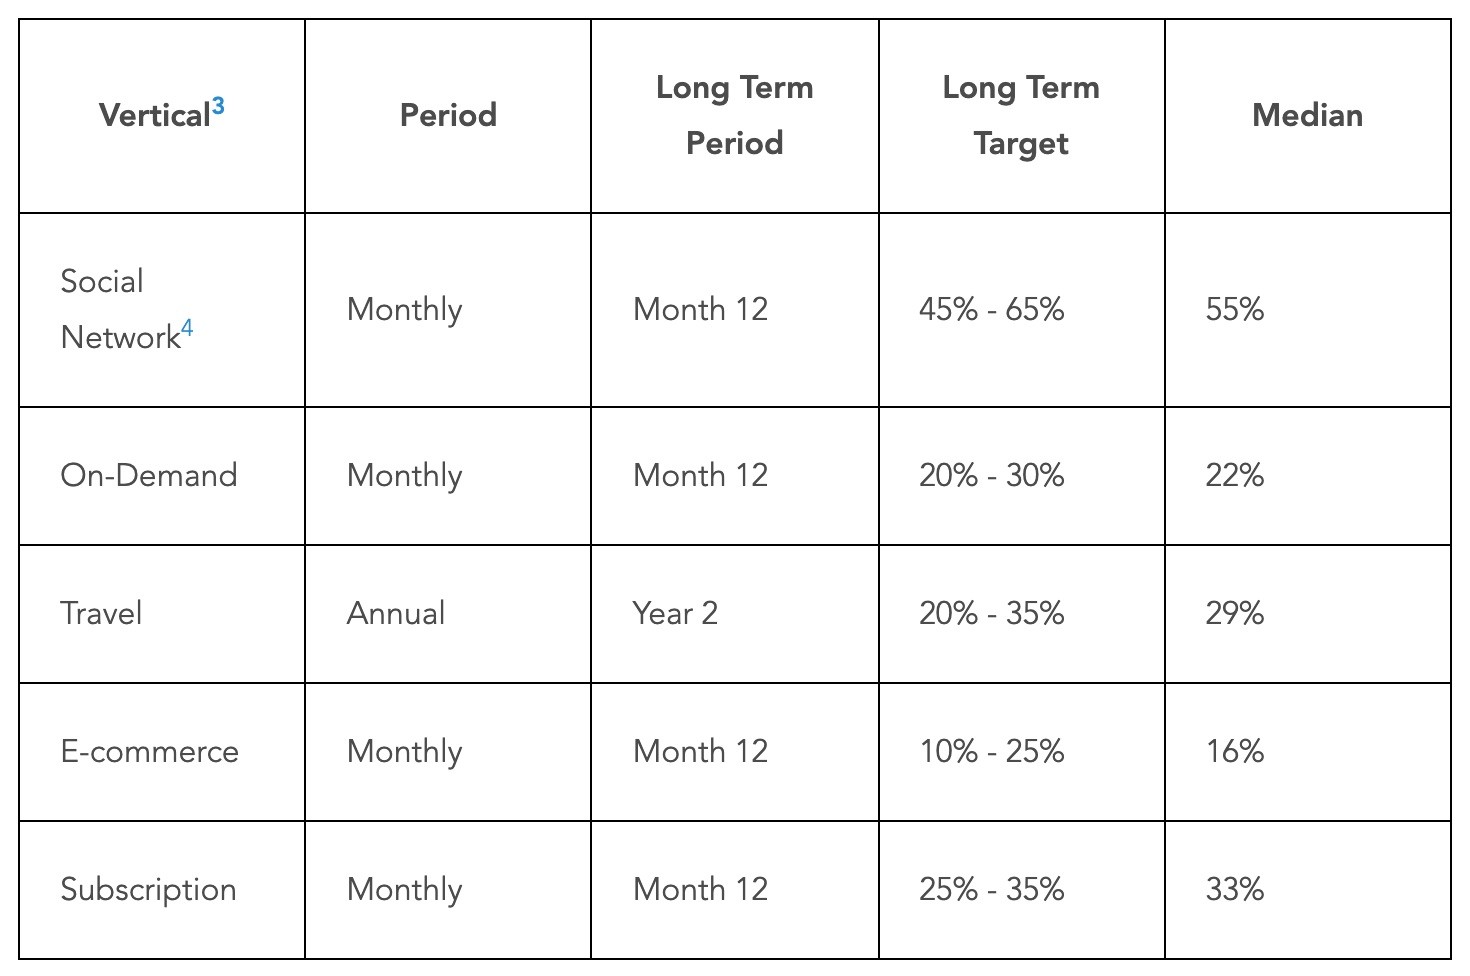
Understanding which category your business falls into and what is the benchmark of that industry can be... challenging. We have some data though, from different verticals, thanks to the YCombinator library.
Next articles
In future articles we will touch on some of User Retention's less discussed aspects: usual problems and issues, how to deploy a Customer Retention program (aka User Retention plan) or picking a customer retention solution.
How can I calculate my metrics?
Try our automatic free audit for a report + analysis by our experts.


