If you are managing a SaaS, no matter if you are the founder, CEO, or CMO, your bandwidth is precious. You have a few minutes per day to evaluate how your business is going. You need to understand how well your efforts to grow your Saas, to acquire and retain more customers are doing.
Why our customers need a metrics dashboard is obvious. Why should Tenstars enter there, that's is a different question. There are many companies focused exclusively around providing data visualisations tools for SaaS. The answer to that is precisely in what we do.
Our core purpose is to help company managers grow their business by improving their customer retention and increasing their revenue with easy to implement tools. We want to provide our customers with easy to understand insights about their business. We started planning how to shape this part of our product with those two premises in mind. Simplicity and actionability.
What was the problem with what we were offering?
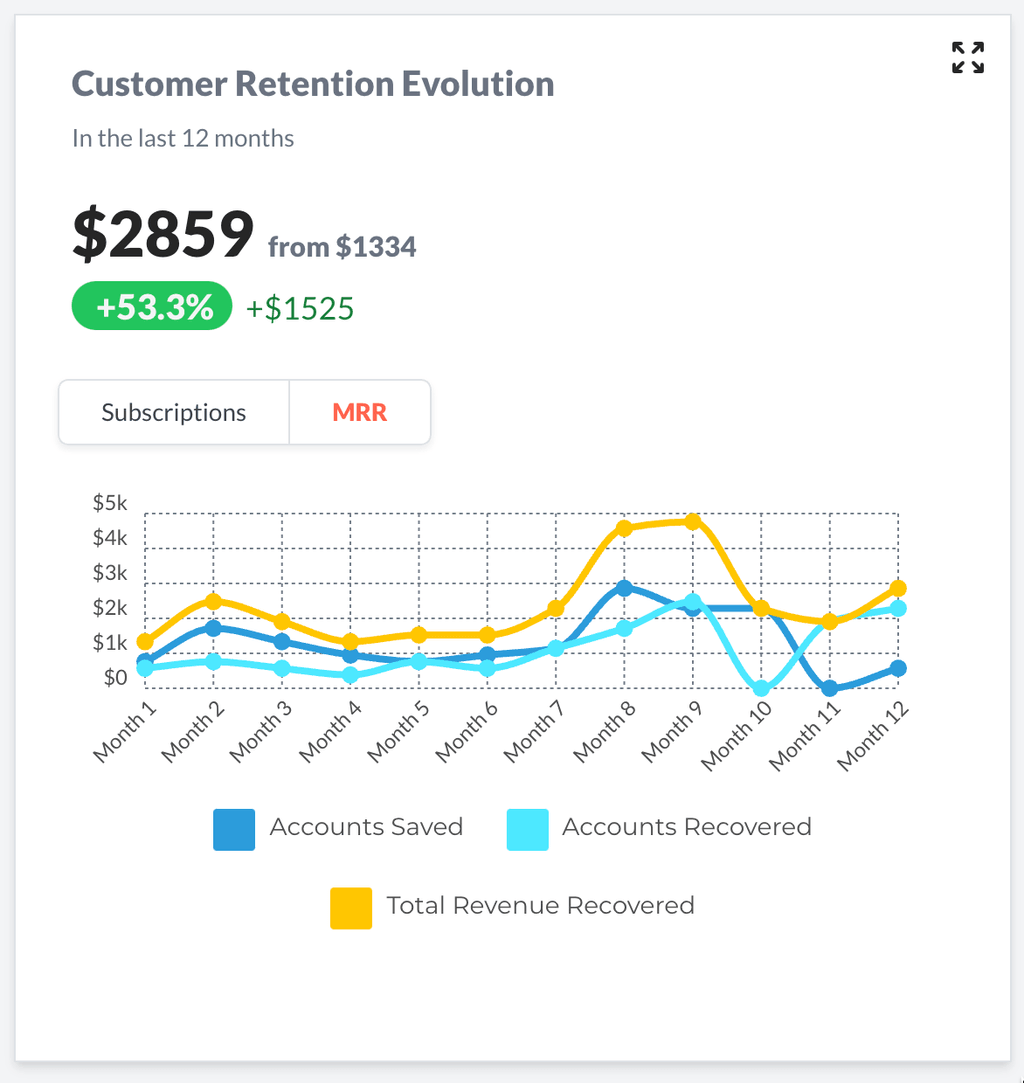
The problem was that we want our users to understand how our Customer Retention tool fits in the overall SaaS strategy. We are proving already specific data about your results. Accounts recovered, revenue rescued, how much has been inverted in incentives to retain customers and useful data points.
Retaining customers and expanding the generated revenue thanks to our growth tools (dynamic pricing, price testing, incentivised upgrades) needs to be understood as part of the bigger picture. At the same time some customers were vocal about requesting more data we already have access to.
What our clients want to know
Our main assumption was that customers want to be able to guide their acquisition and retention efforts. Having one source of truth (if possible).
There is also the question about how we want our tools to be used. There are two modes to utilise metrics and data around your business. To quickly evaluate what is the situation and what needs to be done. A second one, involves performing a deeper analysis of the reasons and sources behind the trends and stories the data tells. In this process of redesigning our metrics dashboard we had to decide where to position ourselves. You can definitely try to be both. Lots of tools out there, devoted to both sides of the problem. For us, a small team with an ambitious roadmap ahead, taking decisions like this are essential.
We had several assumptions about what would be needed. How can we validate our assumptions though? Go gather data, boss.
After doing our research and asking customers (and non customers), it turned out that some of our assumptions were wrong. Clients are not so keen on doing a deep dive in their data, as they are into being able to pinpoint problems and understanding the general trends. They have alternative ways to do a deep analysis. One problem solved.
Some of the questions we had assumed were very important, turned out to be not so critical. It is not that customers do not think some of those issues are not important, but they are not a priority. We've come across some unexpected ones, as well as starting to see the edge cases around building a small solution for that problem.
If you pay attention you’ll find the challenges
The more we analysed the space and the problem, the more challenges and issues we found. The first one was working around slightly different metric definitions in different systems. Metrics have, surprisingly, not universal definitions or standards exists. As an example, churn rate. Should a customer cancellation, still in trial period, be considered as a churned user? Different platforms take different stances around it. We found pretty early that being transparent about how are those metrics calculated and handled is key to gain trust in the data.
Other challenges involved the definition of what goes in our SaaS dashboard template. How to move towards gaining clarity and making it less confusing, versus providing granularity and depth for a more advanced user.
Finding the righht balance between simplicity and depth is key in a SaaS Dashboard template.
Finally we found edge cases or limitations around specific features we want to provide to our customers. Providing a model for forecasting growth can take different shapes, many things can go wrong when you are trying to display a convincing forecast. Some users want to be able to add data outside the payment platforms they are using. Some handle part of their SaaS business manually, via wires or direct debit invoices and want to be able to see it reflected in their data. Other companies use more than on SaaS payment platform provider. Aggregating that data and providing a cohesive picture of the SaaS growth is challenging to say something. Apart from the dashboard capabilities, we had some demands for reporting features...
“I want to send this in my weekly email to my team, right now I am doing a screenshot. Can you make it easy to share?”
A better SaaS dashboard, what can you do now?
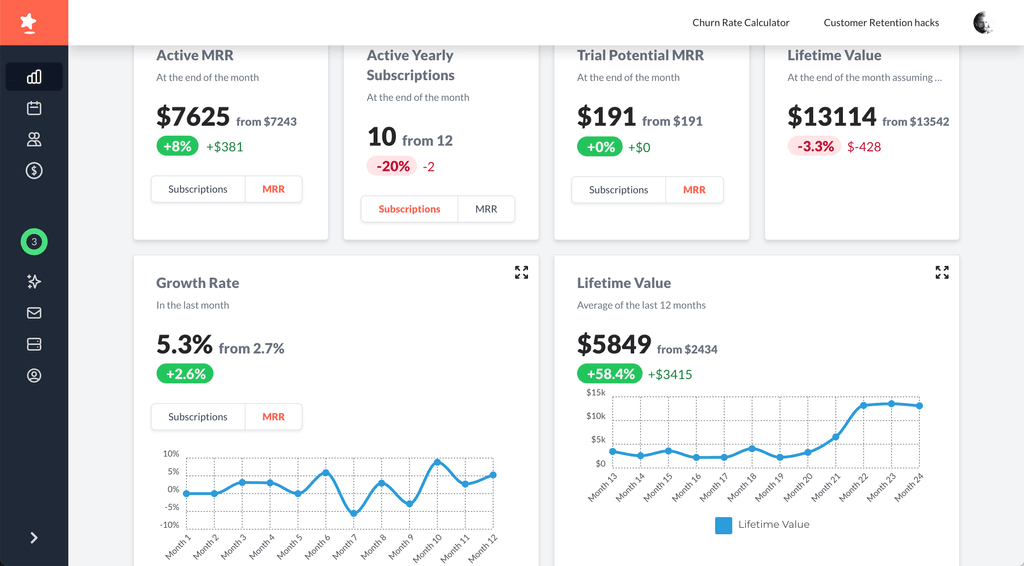
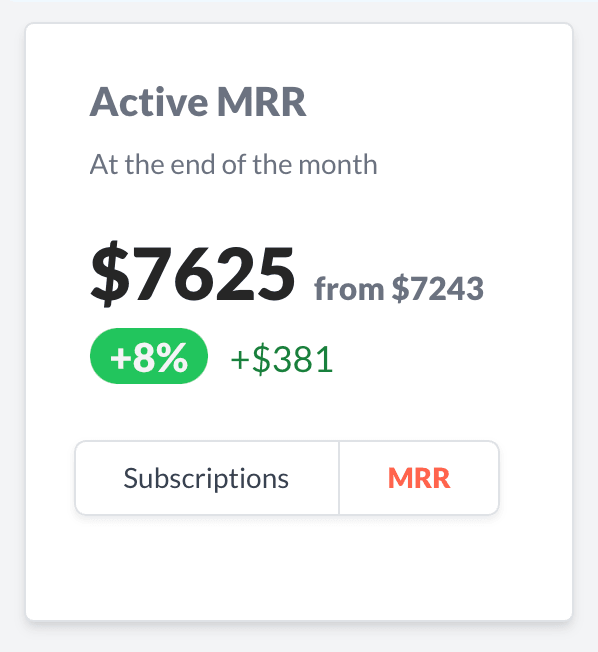
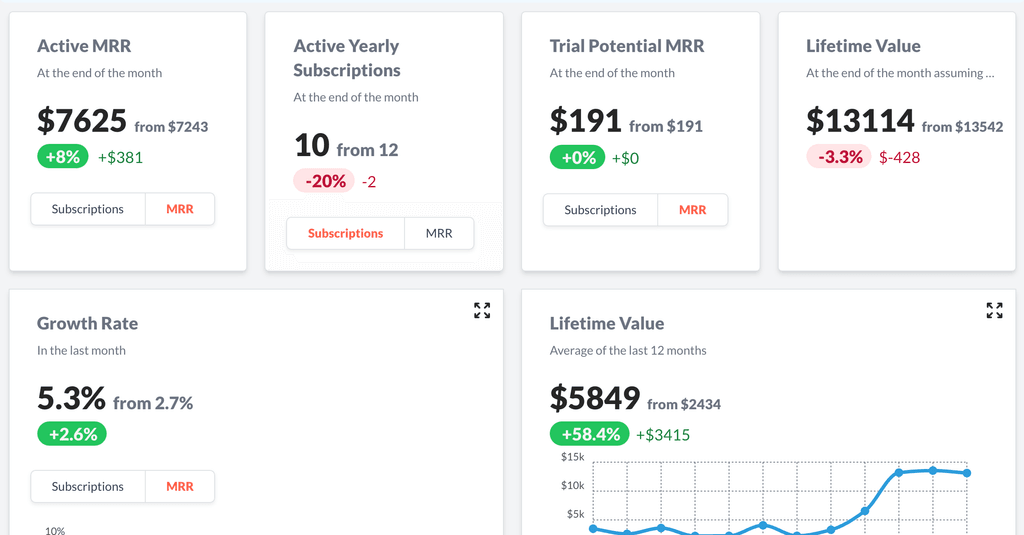
We wanted to start delivering value as soon as possible and decided to phase it accordingly. First, shipping a more complete version of our dashboard. We will expand the scope in upcoming sprints. There is a lot of data we already had available that now is accessible in an easy way. We have re-grouped our metrics charts, you have now a section for Acquisition KPIs and another for the ones related to Retention. You have most to the essential SaaS metrics included, the values for the selected period, as well as the difference with the previous period. Your charts are generated in real time.
You are now able now to check your Churn Rate, how your subscriptions are going, LTV or your SaaS growth. We have included as well, cohort charts and retention curves for you to easily understand how it all works together.
We will also add a button to allow you directly schedule a session to review your metrics and progression with our team. We want to help you understand how your company is doing.
What is next
We have a much, much more ambitious version in our blackboard. What will you be able to do in the future? One of our findings have been how little has changed around data visualisation in the past years.
We want to experiment with the way we present the data! So much innovation waiting to happen in this field!
Our goal is to make our SaaS dashboard and reports an essential part of your business. Supporting all the other growth tools we are providing. We want to be able provide immediate actions from automated insights. Forecasting revenue or subscriptions to give you an unfair advantage planning your strategy. Providing visibility of how your company is doing agains similar companies in the sector is one of our long term goals (our sample is still limited and not big enough as to provide trusted benchmarks).
We found also that there is a lot to improve regarding how price modelling would impact the business bottom line. Providing a good solution will immediately unlock a lot of value for our clients. We’d like as well to connect in a comprehensive way all we do around retention or revenue expansion with your actions and acquisition sources.
All our dashboard features are part of the free plan
Offering all this for free is a core part of our strategy. Keep an eye on this by subscribing to our newsletter or just by creating a new account. A lot is coming your way.

